


Hybrid AC–DC Microgrid Coordinated Control of PV Wind Battery and Grid System

Hybrid AC–DC Microgrid Coordinated Control of PV Wind Battery and Grid System
𝐈𝐧𝐭𝐫𝐨𝐝𝐮𝐜𝐭𝐢𝐨𝐧
A Hybrid AC–DC Microgrid combines AC and DC energy sources, loads, storage devices, and the utility grid within a coordinated power-management structure.
Hybrid AC–DC Microgrid Coordinated Control
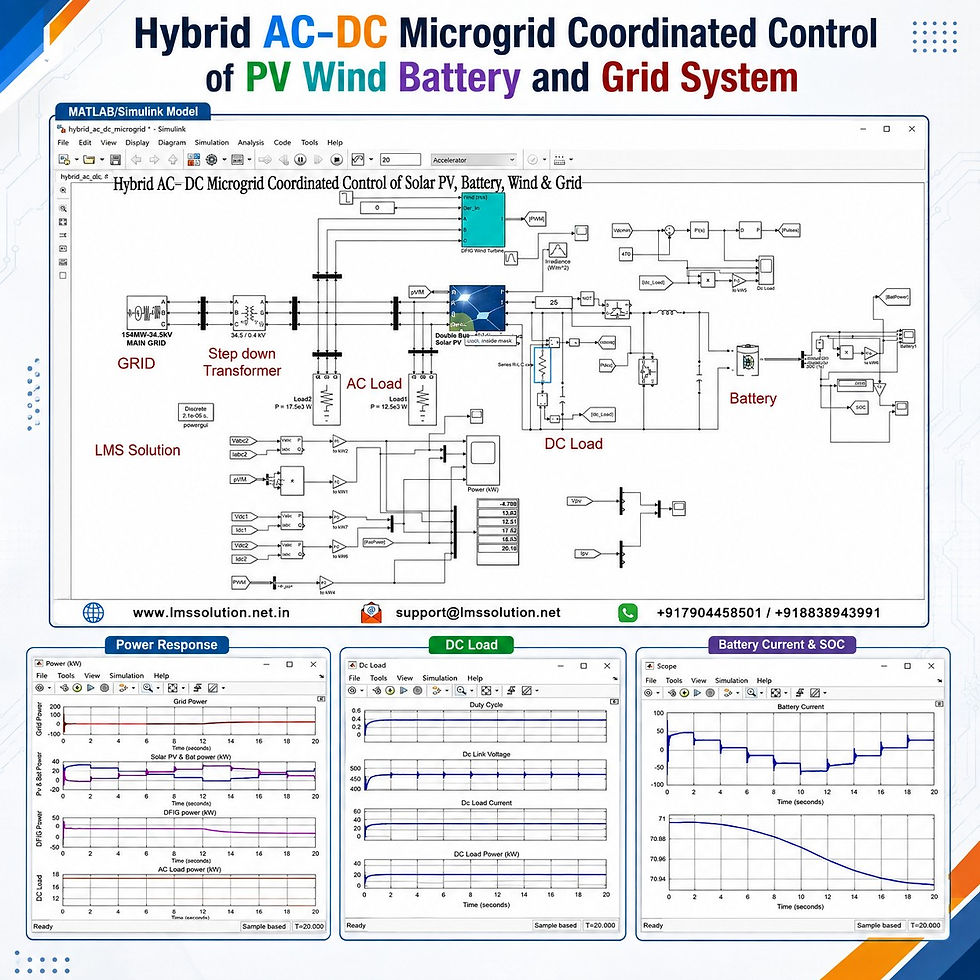
This MATLAB/Simulink model demonstrates the coordinated operation of:
Solar PV generation
DFIG-based wind energy system
Battery energy storage
DC microgrid
AC microgrid
Utility grid
AC and DC loads
Bidirectional power converters
The main objective is to maintain continuous power supply to the connected loads while effectively managing variations in solar irradiation, wind speed, battery charging/discharging, and grid power exchange.
𝐒𝐲𝐬𝐭𝐞𝐦 𝐎𝐯𝐞𝐫𝐯𝐢𝐞𝐰
The complete system is divided into two interconnected sections:
𝗗𝗖 𝗠𝗶𝗰𝗿𝗼𝗴𝗿𝗶𝗱
The DC side consists of:
Solar PV array
Boost converter
DC load
Battery energy storage system
Bidirectional DC–DC converter
Common DC bus
The solar PV system supplies renewable power to the DC bus, while the battery handles surplus and deficit power conditions.
𝗔𝗖 𝗠𝗶𝗰𝗿𝗼𝗴𝗿𝗶𝗱
The AC side consists of:
Utility grid
DFIG wind turbine
Two AC loads
Grid-connected solar inverter
AC/DC interlinking converter
The AC and DC microgrids exchange power through a bidirectional voltage-source converter, allowing energy transfer in either direction according to operating conditions.
𝐌𝐚𝐢𝐧 𝐒𝐲𝐬𝐭𝐞𝐦 𝐒𝐩𝐞𝐜𝐢𝐟𝐢𝐜𝐚𝐭𝐢𝐨𝐧𝐬
Parameter | Value |
Battery nominal voltage | 300 V |
Battery rated capacity | 400 Ah |
Initial battery SOC | 71% |
DC load power | 15 kW |
PV modules in series | 10 |
PV strings in parallel | 15 |
PV module rated power | 228 W |
PV module maximum-power voltage | 29.9 V |
PV module maximum-power current | 7.65 A |
PV module open-circuit voltage | 37.1 V |
PV module short-circuit current | 8.18 A |
Maximum PV array power | Approximately 34 kW |
DFIG wind turbine rating | 45 kW |
AC Load 1 | 17.5 kW |
AC Load 2 | 12.5 kW |
Total AC load | 30 kW |
DC-bus reference voltage | 470 V |
Wind speed before 10 s | 12 m/s |
Wind speed after 10 s | 9 m/s |
Simulation duration | 20 s |
𝐒𝐨𝐥𝐚𝐫 𝐏𝐕 𝐒𝐲𝐬𝐭𝐞𝐦
The solar generation section uses a double-stage grid-connected PV configuration.
The two conversion stages are:
DC–DC boost converter
Three-level grid-connected inverter
The PV array is configured using 10 modules in series and 15 parallel strings.
𝗣𝗩 𝗣𝗲𝗿𝗳𝗼𝗿𝗺𝗮𝗻𝗰𝗲 𝗨𝗻𝗱𝗲𝗿 𝗗𝗶𝗳𝗳𝗲𝗿𝗲𝗻𝘁 𝗜𝗿𝗿𝗮𝗱𝗶𝗮𝗻𝗰𝗲
Solar Irradiance | Approx. Maximum PV Power | Approx. PV Voltage |
1000 W/m² | 34 kW | 299 V |
500 W/m² | 17 kW | 300.5 V |
100 W/m² | 3.3 kW | Approximately 287–289 V |
The results clearly show that PV output power varies significantly with irradiation, while the maximum-power operating voltage remains within a relatively narrow range.
𝐒𝐨𝐥𝐚𝐫 𝐈𝐫𝐫𝐚𝐝𝐢𝐚𝐧𝐜𝐞 𝐏𝐫𝐨𝐟𝐢𝐥𝐞
Solar irradiation is varied every 2 seconds to test the coordinated control under changing renewable-generation conditions.
Time Interval | Irradiance |
0–2 s | 1000 W/m² |
2–4 s | 800 W/m² |
4–6 s | 600 W/m² |
6–8 s | 400 W/m² |
8–10 s | 200 W/m² |
10–12 s | 0 W/m² |
12–14 s | 200 W/m² |
14–16 s | 400 W/m² |
16–18 s | 600 W/m² |
18–20 s | 800 W/m² |
This changing irradiation profile creates repeated variations in PV power and demonstrates how the battery compensates for renewable-power fluctuations.
𝐖𝐢𝐧𝐝 𝐄𝐧𝐞𝐫𝐠𝐲 𝐒𝐲𝐬𝐭𝐞𝐦
The AC microgrid includes a DFIG-based wind turbine system.
Key characteristics include:
Wind turbine rating: 45 kW
Initial wind speed: 12 m/s
Wind-speed change time: 10 s
Final wind speed: 9 m/s
𝗪𝗶𝗻𝗱 𝗣𝗼𝘄𝗲𝗿 𝗕𝗲𝗵𝗮𝘃𝗶𝗼𝗿
From 0 to 10 seconds, the wind turbine operates at 12 m/s and generates relatively high power.
After 10 seconds, wind speed decreases to 9 m/s.
As a result:
Wind-generator output decreases.
Available renewable power on the AC side decreases.
Power exported toward the utility grid is reduced.
Grid power moves closer to zero.
This demonstrates the interaction between wind generation and utility-grid power exchange.
𝐁𝐚𝐭𝐭𝐞𝐫𝐲 𝐄𝐧𝐞𝐫𝐠𝐲 𝐒𝐭𝐨𝐫𝐚𝐠𝐞
The battery plays an important role in balancing power between generation and demand.
Battery specifications are:
300 V nominal voltage
400 Ah rated capacity
71% initial SOC
The battery is connected to the DC microgrid through a bidirectional DC–DC converter.
This converter enables:
Battery charging
Battery discharging
DC-bus voltage support
Renewable-power balancing
Support for AC and DC loads
𝐖𝐨𝐫𝐤𝐢𝐧𝐠 𝐏𝐫𝐨𝐜𝐞𝐬𝐬
The overall energy-management process can be understood in a few simple steps.
1. 𝗦𝗼𝗹𝗮𝗿 𝗣𝗩 𝗚𝗲𝗻𝗲𝗿𝗮𝘁𝗶𝗼𝗻
The PV array generates DC power based on the available solar irradiation.
The boost converter adjusts the PV operating point and transfers the extracted energy to the DC link.
2. 𝗕𝗮𝘁𝘁𝗲𝗿𝘆 𝗣𝗼𝘄𝗲𝗿 𝗕𝗮𝗹𝗮𝗻𝗰𝗶𝗻𝗴
When PV power is high:
The battery can absorb excess energy.
Battery charging occurs.
When PV power decreases:
The battery moves toward discharging.
Stored energy is supplied to support the loads.
3. 𝗪𝗶𝗻𝗱 𝗣𝗼𝘄𝗲𝗿 𝗚𝗲𝗻𝗲𝗿𝗮𝘁𝗶𝗼𝗻
The DFIG supplies power to the AC microgrid.
Its power changes according to the wind-speed profile.
4. 𝗔𝗖–𝗗𝗖 𝗣𝗼𝘄𝗲𝗿 𝗘𝘅𝗰𝗵𝗮𝗻𝗴𝗲
The interlinking converter allows bidirectional energy transfer between the two microgrids.
Depending on generation and load requirements:
DC-side power can support the AC microgrid.
AC-side/grid power can support the DC microgrid.
5. 𝗟𝗼𝗮𝗱 𝗦𝘂𝗽𝗽𝗹𝘆
The system continuously supplies:
15 kW DC load
17.5 kW AC load
12.5 kW AC load
This demonstrates coordinated operation even when renewable generation changes.
𝐂𝐨𝐧𝐭𝐫𝐨𝐥 𝐒𝐭𝐫𝐚𝐭𝐞𝐠𝐲
The model combines several control techniques for renewable generation, inverter operation, battery coordination, and DC-bus regulation.
𝗣&𝗢 𝗠𝗣𝗣𝗧 𝗖𝗼𝗻𝘁𝗿𝗼𝗹
The solar PV boost converter uses the Perturb and Observe MPPT algorithm.
The controller receives:
PV voltage
PV current
Based on these measurements, the controller determines the PV operating reference and adjusts the boost-converter duty cycle.
The objective is to extract the maximum available power from the solar array for different irradiation levels.
𝗗𝗤-𝗔𝘅𝗶𝘀 𝗜𝗻𝘃𝗲𝗿𝘁𝗲𝗿 𝗖𝗼𝗻𝘁𝗿𝗼𝗹
The grid-connected inverter is controlled using the dq control method.
The measured three-phase inverter quantities are converted from the abc reference frame to the dq reference frame.
The current controller then processes the corresponding reference and measured currents and generates the required modulation signals for inverter switching.
This enables controlled power exchange between the PV/DC system and the AC network.
𝗦𝗢𝗖-𝗕𝗮𝘀𝗲𝗱 𝗣𝗼𝘄𝗲𝗿 𝗖𝗼𝗼𝗿𝗱𝗶𝗻𝗮𝘁𝗶𝗼𝗻
Battery SOC is used as one of the control variables for deciding the direction of power exchange.
The implemented logic includes:
Battery SOC Condition | Intended Power-Flow Action |
SOC < 30% | Take power from the grid |
SOC > 70% | Supply available power toward the grid |
This prevents uncontrolled charging or discharging and supports coordinated energy management.
𝗗𝗖-𝗕𝘂𝘀 𝗩𝗼𝗹𝘁𝗮𝗴𝗲 𝗖𝗼𝗻𝘁𝗿𝗼𝗹
The DC-link voltage reference is fixed at approximately 470 V.
The measured DC voltage is compared with this reference.
The resulting error is processed through:
PI controller
PWM generation
Bidirectional-converter switching control
The objective is to maintain a stable DC bus even when solar generation and battery power change.
𝐏𝐨𝐰𝐞𝐫 𝐅𝐥𝐨𝐰 𝐂𝐨𝐨𝐫𝐝𝐢𝐧𝐚𝐭𝐢𝐨𝐧
A major feature of this system is its ability to coordinate multiple power sources dynamically.
𝗛𝗶𝗴𝗵 𝗥𝗲𝗻𝗲𝘄𝗮𝗯𝗹𝗲 𝗚𝗲𝗻𝗲𝗿𝗮𝘁𝗶𝗼𝗻
When PV and wind generation are high:
Renewable sources supply the connected loads.
Excess PV energy can charge the battery.
Remaining power can flow toward the utility grid.
𝗥𝗲𝗱𝘂𝗰𝗲𝗱 𝗦𝗼𝗹𝗮𝗿 𝗣𝗼𝘄𝗲𝗿
When irradiation decreases:
PV output power decreases.
Battery charging is reduced.
The battery begins supplying power when required.
Grid and wind generation contribute to balancing demand.
𝗥𝗲𝗱𝘂𝗰𝗲𝗱 𝗪𝗶𝗻𝗱 𝗣𝗼𝘄𝗲𝗿
When wind speed decreases from 12 m/s to 9 m/s:
Wind power decreases.
Exported grid power reduces.
Other energy sources participate in maintaining the power balance.
𝐒𝐢𝐦𝐮𝐥𝐚𝐭𝐢𝐨𝐧 𝐑𝐞𝐬𝐮𝐥𝐭𝐬
The simulation results demonstrate the response of the complete microgrid over a 20-second operating period.
𝗚𝗿𝗶𝗱 𝗣𝗼𝘄𝗲𝗿
Initially, between 0 and 10 seconds, grid power is negative.
According to the adopted sign convention, this indicates that:
Power is being supplied toward the grid.
Renewable generation from PV and wind contributes to this export condition.
After 10 seconds:
Wind speed decreases.
DFIG output decreases.
Grid-export power decreases.
Grid power moves closer to zero.
This demonstrates that the utility-grid power automatically responds to variations in renewable generation.
𝗦𝗼𝗹𝗮𝗿 𝗣𝗩 𝗣𝗼𝘄𝗲𝗿
At the highest irradiation level, PV output is approximately 33–34 kW.
As irradiation decreases every two seconds:
PV power reduces step-by-step.
It reaches a minimum when irradiation reaches zero.
PV power rises again as irradiation increases.
The response follows the imposed solar profile and demonstrates the operation of the P&O MPPT controller.
𝗕𝗮𝘁𝘁𝗲𝗿𝘆 𝗖𝗵𝗮𝗿𝗴𝗶𝗻𝗴 𝗮𝗻𝗱 𝗗𝗶𝘀𝗰𝗵𝗮𝗿𝗴𝗶𝗻𝗴
At high solar irradiation:
PV generation is relatively high.
The battery initially operates in charging mode.
As irradiation decreases:
Available PV power drops.
Battery power changes accordingly.
The battery transitions toward discharging to compensate for the reduced solar contribution.
When PV generation starts increasing again:
The battery power changes correspondingly.
Charging conditions can return as renewable generation becomes sufficient.
This response demonstrates coordinated operation between the PV source and battery storage system.
𝗕𝗮𝘁𝘁𝗲𝗿𝘆 𝗦𝗢𝗖
The SOC starts at approximately 71%.
As the battery supports the loads during reduced solar generation:
Battery current changes from charging to discharging.
SOC gradually decreases.
The SOC trend confirms that the battery is actively participating in the microgrid power-balancing process.
𝗗𝗖-𝗕𝘂𝘀 𝗩𝗼𝗹𝘁𝗮𝗴𝗲
Despite repeated irradiation changes and battery power variations, the DC-link voltage remains close to:
470 V
This is an important result because stable DC-bus voltage is required for proper interaction between:
PV converter
Battery converter
DC load
AC/DC interlinking converter
The result demonstrates the effectiveness of the DC-voltage control loop.
𝗗𝗖 𝗟𝗼𝗮𝗱 𝗣𝗲𝗿𝗳𝗼𝗿𝗺𝗮𝗻𝗰𝗲
The DC load is approximately:
15 kW
Even with changing solar irradiation, the DC load continues to receive the required power.
The observed DC-load quantities include:
DC-bus voltage
DC-load current
DC-load power
Bidirectional-converter duty cycle
The results show that the coordinated sources maintain stable load operation.
𝗔𝗖 𝗟𝗼𝗮𝗱 𝗣𝗲𝗿𝗳𝗼𝗿𝗺𝗮𝗻𝗰𝗲
Two AC loads are connected to the microgrid.
AC Load | Power |
Load 1 | 17.5 kW |
Load 2 | 12.5 kW |
Total | 30 kW |
The AC loads continue receiving power while the generation profile changes, illustrating successful coordination among:
DFIG wind source
Solar PV system
Battery
Utility grid
𝐒𝐢𝐦𝐮𝐥𝐚𝐭𝐢𝐨𝐧 𝐌𝐨𝐧𝐢𝐭𝐨𝐫𝐞𝐝 𝐏𝐚𝐫𝐚𝐦𝐞𝐭𝐞𝐫𝐬
The MATLAB/Simulink model monitors several important operating variables.
Power Measurements
Utility-grid power
Solar PV power
Wind-generator power
Battery power
AC Load 1 power
AC Load 2 power
DC-load power
Battery Measurements
Battery voltage
Battery current
Battery power
Battery SOC
DC Microgrid Measurements
DC-link voltage
DC-load current
DC-load power
Bidirectional-converter duty cycle
These measurements help analyze the complete energy flow of the hybrid microgrid.
𝐊𝐞𝐲 𝐅𝐞𝐚𝐭𝐮𝐫𝐞𝐬
Hybrid AC and DC microgrid architecture
Integration of PV, wind, battery, utility grid, AC loads and DC load
Approximately 34 kW solar PV array
45 kW DFIG wind turbine
300 V, 400 Ah battery storage
15 kW DC load
30 kW total AC load
Bidirectional AC–DC power exchange
Bidirectional battery converter
P&O MPPT for solar power extraction
dq-axis inverter control
PI-based DC-link voltage regulation
SOC-based grid power coordination
Dynamic solar irradiation testing
Dynamic wind-speed testing
Battery charging and discharging analysis
470 V regulated DC bus
Complete power-flow monitoring in MATLAB/Simulink
𝐖𝐡𝐲 𝐇𝐲𝐛𝐫𝐢𝐝 𝐀𝐂–𝐃𝐂 𝐌𝐢𝐜𝐫𝐨𝐠𝐫𝐢𝐝𝐬 𝐀𝐫𝐞 𝐔𝐬𝐞𝐟𝐮𝐥
Traditional systems may require repeated AC-to-DC or DC-to-AC conversion when renewable sources, batteries, and modern electronic loads are connected together.
A hybrid AC–DC architecture allows suitable devices to remain connected to their natural bus.
Typical DC-Side Devices
Solar PV systems
Battery storage
DC electronic loads
EV-related DC interfaces
DC distribution systems
Typical AC-Side Devices
Utility grid
Wind generators
AC motors
Conventional AC loads
Building electrical systems
The interlinking converter enables both networks to operate together as a coordinated energy system.
𝐀𝐩𝐩𝐥𝐢𝐜𝐚𝐭𝐢𝐨𝐧𝐬
This Hybrid AC–DC Microgrid MATLAB model is useful for studying:
Smart microgrid control
Renewable-energy integration
Solar PV and wind coordination
Battery energy-management systems
AC/DC power-flow management
Bidirectional converter control
DC-bus voltage stabilization
Grid-connected renewable-energy systems
Distributed energy-resource integration
Energy-storage coordination
Smart building energy systems
Campus microgrids
Industrial microgrids
Residential renewable-energy networks
Research on coordinated microgrid control
𝐖𝐡𝐚𝐭 𝐓𝐡𝐢𝐬 𝐌𝐀𝐓𝐋𝐀𝐁/𝐒𝐢𝐦𝐮𝐥𝐢𝐧𝐤 𝐌𝐨𝐝𝐞𝐥 𝐃𝐞𝐦𝐨𝐧𝐬𝐭𝐫𝐚𝐭𝐞𝐬
The simulation provides a clear demonstration of how multiple energy resources can work together within a single system.
It helps users understand:
How solar irradiation affects PV output.
How wind-speed reduction affects DFIG power.
How battery current changes during charging and discharging.
How SOC responds to changing power demand.
How the grid absorbs or supplies power.
How the DC bus can remain regulated at approximately 470 V.
How AC and DC loads remain supplied under changing renewable conditions.
How coordinated control maintains the overall power balance.
𝐊𝐞𝐲 𝐑𝐞𝐬𝐮𝐥𝐭𝐬 𝐚𝐭 𝐚 𝐆𝐥𝐚𝐧𝐜𝐞
Performance Aspect | Observed Behaviour |
Maximum PV generation | Approximately 34 kW |
PV response | Changes according to irradiation |
Wind-speed variation | 12 → 9 m/s at 10 s |
Wind power | Decreases after wind-speed reduction |
Battery operation | Charging and discharging |
Battery SOC | Gradually changes according to power balance |
DC-link voltage | Maintained around 470 V |
DC load | Maintained around 15 kW |
Total AC load | Approximately 30 kW |
Grid power | Adjusts according to renewable generation |
AC/DC power transfer | Bidirectional |
Renewable coordination | PV, wind and battery jointly support loads |
𝐁𝐞𝐧𝐞𝐟𝐢𝐭𝐬 𝐨𝐟 𝐭𝐡𝐞 𝐂𝐨𝐨𝐫𝐝𝐢𝐧𝐚𝐭𝐞𝐝 𝐂𝐨𝐧𝐭𝐫𝐨𝐥
The coordinated control strategy provides several important benefits:
Improved utilization of renewable energy
Controlled battery charging and discharging
Stable DC-bus operation
Continuous power supply to AC and DC loads
Flexible bidirectional power exchange
Reduced dependency on a single energy source
Better response to solar and wind variations
Effective integration of storage and utility grid
Clear visualization of microgrid power flow
𝐂𝐨𝐧𝐜𝐥𝐮𝐬𝐢𝐨𝐧
The Hybrid AC–DC Microgrid Coordinated Control of PV Wind Battery and Grid System demonstrates the integration and coordinated operation of multiple distributed energy resources in MATLAB/Simulink.
The developed system combines approximately 34 kW solar PV generation, a 45 kW DFIG wind turbine, a 300 V/400 Ah battery, a 15 kW DC load, two AC loads totaling 30 kW, and the utility grid.
The simulation evaluates the system under continuously varying solar irradiation and a wind-speed transition from 12 m/s to 9 m/s. As renewable generation changes, the battery automatically shifts between charging and discharging conditions to support the required power balance.
A major result is the successful regulation of the DC-link voltage at approximately 470 V, even when PV generation changes significantly. The utility grid also responds dynamically to variations in PV and wind generation.
Overall, the model provides a practical platform for understanding hybrid AC–DC microgrids, renewable-energy coordination, battery energy management, bidirectional power flow, MPPT control, dq inverter control, and DC-bus voltage regulation.


Comments